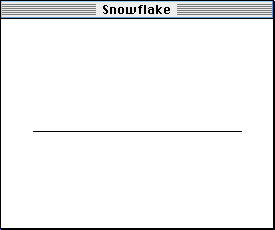
Suppose we have a line segment, as pictured below...

and we grab hold of it and put a kink into it like this...
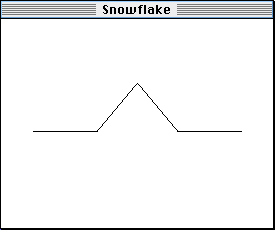
That simple process--taking a line segement and putting a kink into it--can be considered a "drawing rule". In words, the rule would be "when you see a line segment (like the one in the first picture), put a kink into it so that it looks like the second picture". If we wanted to, we could apply this drawing rule to any line segment. ("But why would we want to?" you're probably wondering. One answer to that would be "Because if you do it right, it makes some really cool pictures!". Read on to see how.)
Here's what that would look like:
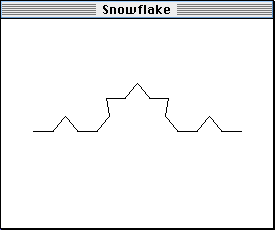
In this picture, we've done exactly the same thing to each of the four little segments (from the second picture) that we did to the big segment that was in the first picture.
What we have done here is known as "iterating" the drawing process. Iterative processes generally take some kind of input (in this case, a straight line segment), apply some rule to that input (in this case, "put a kink in it"), and then go back and apply the same rule to whatever comes out. In our example, we have done two iterations--we applied the rule to the first segment, and then we applied the same rule to all of the segments that resulted from the first time we applied the rule.
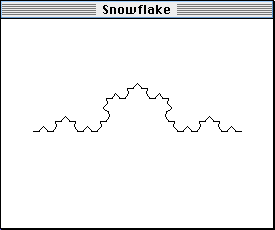
And naturally if we took that and applied rule to it, we would have the fourth iteration, which would look something like this:
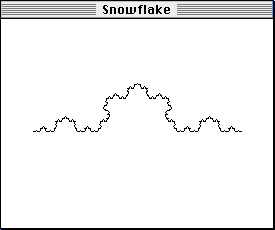
Why is this possibly the best news you've heard all day? Well, for one thing, imagine you had to draw iteration 4 of the rule we've been using as an example. Iteration 1 required four segments, and iteration 2 made four segments for each of those four segments, for a total of sixteen segments. Then iteration 3 put four segments in place of each of those, giving 64 total segments, and finally iteration 4 required four segments in place of all 64 of iteration 3's segments, giving us a hefty 256 line segments. A PowerMac can draw iteration 4 in about the time it takes you to blink. If you had to draw all 256 of these segments yourself, it would take a little longer, for one thing, and it would probably be more than a little tedious. And once you got done with that, you would probably not be interested in setting out to draw the 1024 segments required for iteration 5. Plotting, say, eight iterations, which, in this case, if you drew one segment per second, would would take you 65,536 seconds (about 18 hours), compared to about six seconds on the Mac.
The great thing about having the computer do all of this tedious work for us is that it allows us to explore all kinds of "what if" questions very quickly and painlessly. For example, what if the original rule was similar to this, but with a slightly different shaped kink, like this:

Snowflake could easily show you that the fourth and fifth iterations look like this:
 |  |
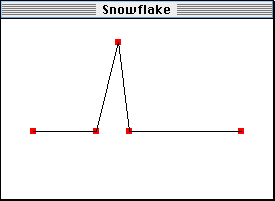
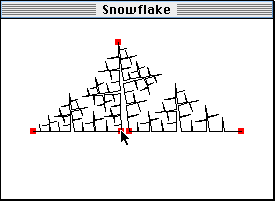
In the PowerMac version of Snowflake, you can drag these points around to change the drawing rule, and the image is updated as you go. Here's a picture of it "in action", dragging one of the control points in the picture above and drawing the fourth iteration:
Note:
The online version doesn't exactly allow "dragging" the points. Rather,
it lets you choose which point you want to move, and then click on the
location you want the point to move to. This is somewhat less interactive,
because you don't get the update-as-you-go effect, but it turns out to
have its advantages, too.
