Snowflake--Limits and Infinity

Introduction

The concepts of infinity, infinite processes, and limits are fundamental to the mathematics used by virtually every field of science. However, due to the esoteric nature of this fundamentality, these concepts are generally touched upon and forgotten in calculus courses and never heard from again. Leaving these important concepts out robs mathematics of some of its intricate beauty--failing to introduce them earlier in the mathematics curriculum lessens the chance that they will be understood when they are discussed in greater detail. This instruction module attempts to present students with a gentle introduction to the idea of a limiting process through an activity with a fractal generating application called Snowflake. Along the way, various mathematical concepts and tools are used.

Objectives

Standards

These lesson ideas and activities address the following standards from the National Council of Teachers of Mathematics Curriculum Standards:

Overview

Students will first be introduced to a method of generating fractal curves. They will apply this method "by hand", using pencils and graph paper to generate the first few iterations of a fractal curve. Various concepts about the curve's properties will be investigated. "What if" questions lead to the need for another way to implement the "drawing rule", and the computer program Snowflake is introduced. The idea of a limit is investigated. In the course of the activity, the concepts of exponentiation and the multiplication and addition of fractions are encountered.

Materials

Graph paper, colored pencils or markers, the application "Snowflake", a pattern file (optional) for the students to start with, and a computer on which to run this application. This could be adapted to a single computer (or, with somewhat more effort, computerless) classroom.

Actvities

  1. Have the students create the first few iterations of the following fractal curve on graph paper:
    1. They should start with a horizontal line that is nine units long. (For convenience, let one unit be equal to the length of a side of one square on the graph paper.)
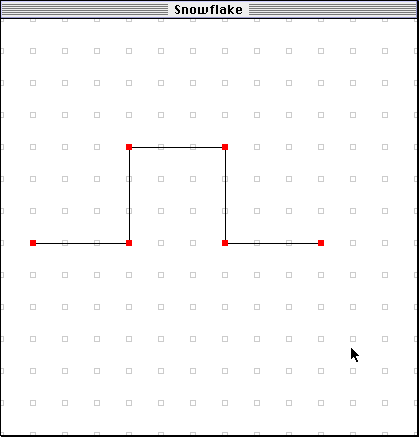
    2. The first iteration is drawn as follows. Make a horizontal line three units long (moving right), then move vertically upward three units, then right three more units, then down three units, then right three units. In effect, you place a square with side length three units on the middle of the original line, then "erase" the bottom side of the square. (There's an illustration below to prove that a picture is worth at least as many words as this paragraph has...)
    3. The second iteration "does the same thing" to each of the five segments of the first iteration. That is, the middle third of each segment from the first iteration is replaced with a similar "square bump". The third iteration starts with the second iteration, and replaces each of the segments with a "square bumped" segment.

    Each iteration should be drawn seperately. However, it may be easier to draw the second iteration if the first iteration is drawn again lightly, and then the necessary "alterations" are made. Similarly, drawing the third iteration is much easier if a copy of the second is used as a guide. One alternative is to use one color of ink for the copy of the previous iteration, and another for the new iteration.

  2. Ask the students how many line segments they drew for each iteration (1, 5, 25, 125). How many line segements would it take to draw the next iteration? (625)
  3. Discuss the length of the curve at each iteration. One way of calculating the length is to figure out the size of each segment and multiply that by the number of segments (since in this case all the segments are the same size). A table would be helpful in organizing this information, as well as helping the students identify patterns.
    IterationNumber of segmentsLength of each segmentTotal length
    0199
    15315
    225125
    31251/3125/3
    46251/9625/9
    The patterns in each of the last three columns are exponential (and in fact, they are geometric sequences). Depending on the preparation of your students, you may wish to have them try to discover this themselves, in groups, or as a class (or not at all--farbeit from me to tell you what your kids are ready for!). The last column in particular can be useful as an exercise in number sense. Following are some possible discussion questions.
  • Now have the students explore the same curve with Snowflake. Return to the question of how many segments would have to be drawn for the fourth iteration. How long would it take them to do this? How about the fifth iteration? What if they wanted to start with a slightly different initial curve? It shouldn't take much imagination to see how much work it would be to make even a simple modification to the original curve and investigate higher numbers of iterations. The point of this line of questions is to motivate the introduction of a computer program to help us with this problem. Computers are good for doing large numbers of repetitive tasks, and that is exactly the situation we have here.
    1. Have the students open (or create for themselves) a Snowflake pattern with the following specifications. Use 6 control points (set this under the Snowflake menu). Set Grid Size to large, Grid Shape to Square, and make sure Snap to Grid is checked (these are all in the Options menu). Put the first (the leftmost) control point on a grid point near the left edge of the screen. Put the second control point three steps straight to the right of that (that is, on the same level vertically). Put the third point directly above the second, three gridpoints away. Put the fourth point three points to the right of that. Put the fifth point three down from the fourth. Put the sixth point three to the right of the fifth. (The pattern should be right, up, right, down, right.)

    2. Once the curve is properly set up, they should save it so that they can return to it later if they wish to.
    3. Have them set the iteration number to one. At this point, the picture on their screen should be something like this:

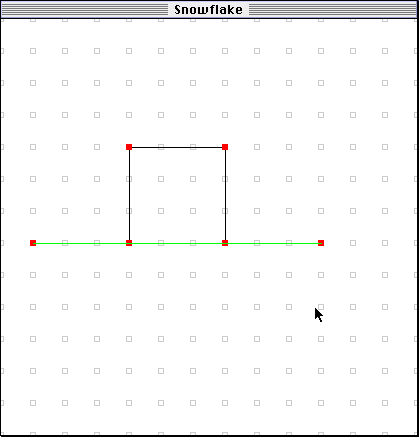
    4. Now have them set "Show Iteration Zero" from the Options menu. At this point, the picture on their screen should be something like this:

    5. Ask the students how much area is bounded by the black and green lines in this figure. (They will have to decide on a unit size, or, depending on the chaos you think that would cause, you may wish to decide for them.) Suppose that we set one step on the grid to be one unit length. That gives the initial square an area of nine. (An alternative would be to set the unit length equal to three steps on the grid, giving the original square the convenient area of one).
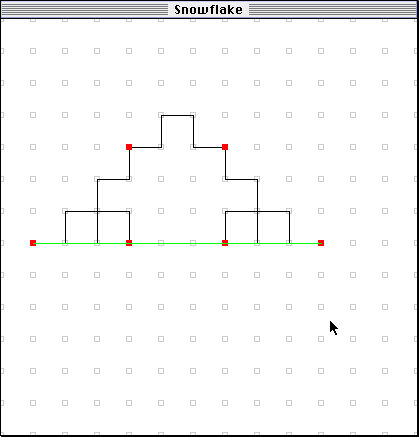
    6. Now set the number of iterations to two. What is the new area? (Note: it may be difficult at first for them to realize what the "bounded area" is, since the new curve just touches itself at the corners.

      Refer them to their graph paper version of the fractal, and have them color in the bounded area. Moving the second and fifth control points slightly (with Snap to Grid turned off) can give a better sense of how the curve is actually shaped, as well.

    7. Increase the number of iterations by one and have the students figure out what the area is now. This figure may be a bit daunting at first,

      but a simple problem solving strategy can help out. If they again refer to the graph paper version, and this time color-code the area by iteration--that is, color the large square from the first iteration blue, the five smaller squares from the second iteration green, and the 25 smallest squares from the third iteration red.

      Again, they can use the method of counting the number of squares, calculating the area of one square, and then multiplying to get the total added area.

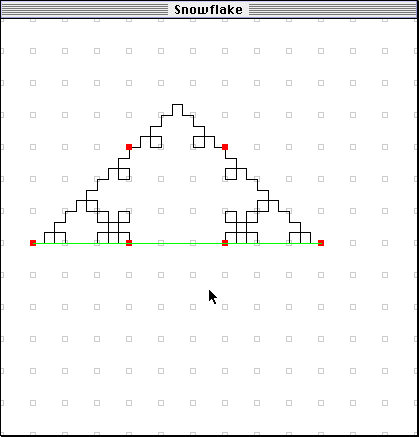
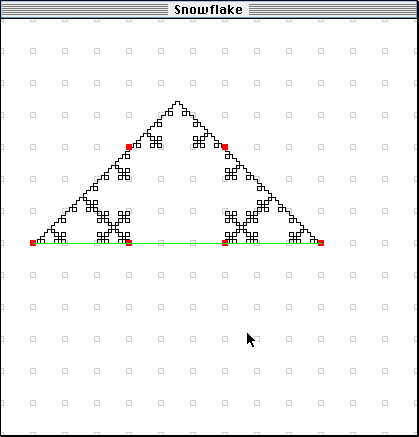
    8. Increase the number of iterations again. This is the last iteration in which the shape of the curve is still clearly visible:

      Ask the students what would happen eventually if we kept increasing the number of iterations. They can experiment by increasing the iterations. What do they notice? Will the total area keep getting bigger?

      The area will continue to increase, but it increases by a smaller amount each time. Notice how, as the iterations increase, the overall shape of the pattern seems to be "filling" a triangle. What is the area of that traingle? Will the area bounded by the curve ever get bigger than that area?

    The Big Picture

    The idea of an amount increasing step by step and either getting closer and closer to a particular number or growing without bound is an important concept in mathematics. It is also a fascinating idea all by itself. The fact that we have discovered ways of dealing with such things is an important achievement in mathematics, and took many decades to develop.

    Thinking Harder

    Possible extensions to this activity include
    Return to the Help Index.